Salt la conținutul principal

Cum se creează o diagramă cu data și ora pe axa X în Excel?

În Excel, de obicei inserăm o diagramă pentru a descrie mai bine datele. Dar, în unele cazuri, atunci când creați o diagramă coloană / bară / linie pe baza unei serii de date și ore, axa X a diagramei poate fi afișată ca în imaginea de mai jos. Și în acest articol, introduc modul în care se arată corect data și ora pe axa X în diagramă.
diagramă doc cu ora dată 1

Creați corect un grafic cu data și ora pe axa X.


săgeată albastru dreapta balon Creați corect un grafic cu data și ora pe axa X.

Pentru a afișa corect data și ora, trebuie doar să schimbați o opțiune în Formatează axa dialog.

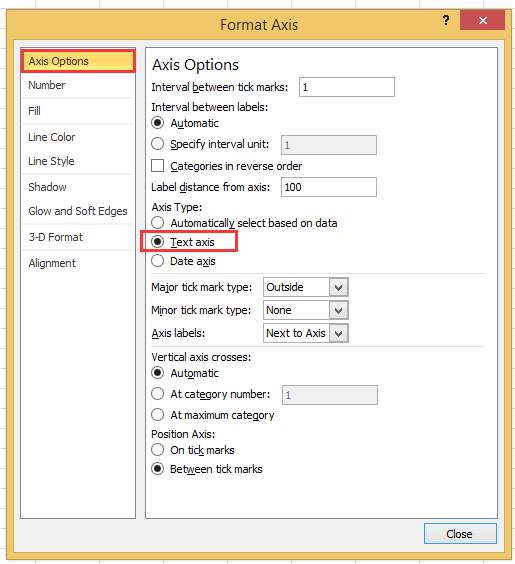
1. Faceți clic dreapta pe axa X din diagramă și selectați Formatează axa din meniul contextual. Vedeți captura de ecran:
diagramă doc cu ora dată 2

2. Apoi în Formatează axa panoul sau Formatează axa dialog, sub Opțiuni Axis fila, verificați Axa textului opțiune în Tipul axei secțiune. Vedeți captura de ecran:
  diagramă doc cu ora dată 4
Dacă utilizați versiunea Excel mai târziu de 2010, puteți vedea un panou Format Axis care apare și bifați opțiunea Axă text sub Tip axă în grupul Opțiuni axă.
diagramă doc cu ora dată 3

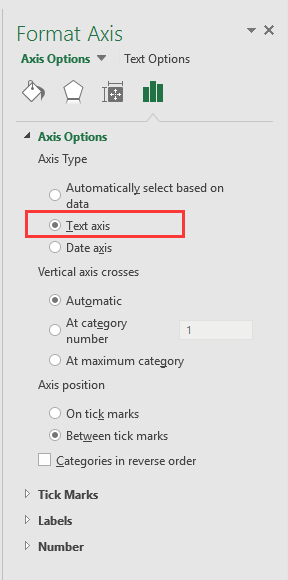
3. clic Închide sau reveniți la diagramă, apoi datele de dată și oră au fost afișate corect pe axa X. Vedeți captura de ecran:
diagramă doc cu ora dată 5


Creați o diagramă a vitezometrului cu doi pași!

Uneori, poate doriți să utilizați o diagramă a vitezometrului pentru a afișa prețul unui proiect, dar în Excel, pentru a crea o diagramă a vitezometrului aveți nevoie de mai mulți pași care sunt complexi și pierdeți timp. Aici Diagrama vitezometrului instrumentul din Kutools pentru Excel vă poate ajuta să creați o diagramă a vitezometrului standard cu doi pași simpli. Descărcați acest instrument cu o încercare gratuită de 30 de zile acum.
diagramă vitezometru doc

Cele mai bune instrumente de productivitate de birou

🤖 Kutools AI Aide: Revoluționați analiza datelor pe baza: Execuție inteligentă   |  Generați codul  |  Creați formule personalizate  |  Analizați datele și generați diagrame  |  Invocați funcțiile Kutools...
Caracteristici populare: Găsiți, evidențiați sau identificați duplicatele   |  Ștergeți rândurile goale   |  Combinați coloane sau celule fără a pierde date   |   Rundă fără Formula ...
Super căutare: VLookup cu mai multe criterii    VLookup cu valori multiple  |   VLookup pe mai multe foi   |   Căutare fuzzy ....
Listă derulantă avansată: Creați rapid o listă derulantă   |  Listă drop-down dependentă   |  Listă derulantă cu selectare multiplă ....
Manager de coloane: Adăugați un număr specific de coloane  |  Mutați coloanele  |  Comutați starea vizibilității coloanelor ascunse  |  Comparați intervale și coloane ...
Caracteristici prezentate: Focus pe grilă   |  Vedere de proiectare   |   Big Formula Bar    Manager registru de lucru și foi   |  Biblioteca de resurse (Text automat)   |  Data Picker   |  Combinați foi de lucru   |  Criptare/Decriptare celule    Trimiteți e-mailuri după listă   |  Super Filtru   |   Filtru special (filtrează bold/italic/barat...) ...
Top 15 seturi de instrumente12 Text Instrumente (Adăuga text, Eliminați caractere,...)   |   50+ Diagramă Tipuri de (Gantt Chart,...)   |   40+ Practic Formule (Calculați vârsta pe baza zilei de naștere,...)   |   19 inserare Instrumente (Introduceți codul QR, Inserați imaginea din cale,...)   |   12 Convertire Instrumente (Numere la cuvinte, conversie valutara,...)   |   7 Merge & Split Instrumente (Rânduri combinate avansate, Celule divizate,...)   |   ... și altele

Îmbunătățiți-vă abilitățile Excel cu Kutools pentru Excel și experimentați eficiența ca niciodată. Kutools pentru Excel oferă peste 300 de funcții avansate pentru a crește productivitatea și a economisi timp.  Faceți clic aici pentru a obține funcția de care aveți cea mai mare nevoie...

Descriere


Fila Office aduce interfața cu file în Office și vă face munca mult mai ușoară

  • Activați editarea și citirea cu file în Word, Excel, PowerPoint, Publisher, Access, Visio și Project.
  • Deschideți și creați mai multe documente în filele noi ale aceleiași ferestre, mai degrabă decât în ​​ferestrele noi.
  • Vă crește productivitatea cu 50% și reduce sute de clicuri de mouse pentru dvs. în fiecare zi!
Comments (23)
No ratings yet. Be the first to rate!
This comment was minimized by the moderator on the site
I have the same issue when graphing data that has date AND time: points on the graph are equally spaced, whereas the underlying data has unequal gaps between datapoints. Data is in the form "dd/mm/yyyy hh:mm" formatted as date/time (not text). Data spans multiple days so it's not possible to extract just the time element.
This comment was minimized by the moderator on the site
I have a chart with x-axis in time that stretches during about 6h and 35min. I have data for each 20min in the beginning, then 15min and lastly each 10min. Also, in between I have 45min and 5min data.. The issue that I have, and several others, is that each gap between the date are equally spaced out. Meaning that, even if it is only 5min the gap is the same as if it was 45min.
This comment was minimized by the moderator on the site
i want to make a line graph which contains thousand of entries it's included date, time, month and year, so please help me out.
This comment was minimized by the moderator on the site
Hi, syed Mubashir alam, I do not understand your quetion, if you just create a line graph and the x-axis contains month/day/year hour:minute as below screenshot shown:
https://www.extendoffice.com/images/stories/comments/sun-comment/line-chart-1.png
just follow above steps of the article. If your question is about the axis contents are to long, there is no good idea.
This comment was minimized by the moderator on the site
i want to make a line graph which contains thousands of entries including time, date, month and year but i couldn't make a line graph so please help me out.
This comment was minimized by the moderator on the site
It's good coment that point is not a comma. When you want to add more numericals numbers you should use comma in excel ;)
This comment was minimized by the moderator on the site
Excel menus have changed - this is an out of date article - please update for 2020 .. e.g where is AXIS TYPE now?
This comment was minimized by the moderator on the site
I did not found Excel 2020, just 365 2019, which menus are the same as 2013,2016 version.
This comment was minimized by the moderator on the site
How do I remove days that don't have data in them. Example 8/1-8/31 but not data was captured on 8/3 or 8/4, how do I remove those dates from my graph? They are not in my data table so why is it pulling them?
This comment was minimized by the moderator on the site
Open the Excel file that holds the chart from which you want to exclude dates. Click the X-axis, located underneath the chart, so that it becomes surrounded by a small box. Right-click inside the box and choose "Format Axis" from the popup menu. Click "Axis Options" on the left side of the "Format Axis" window. Locate the three "Axis Type" options in the middle of the screen on the right side of the window. Click the radio button next to "Text axis."
This comment was minimized by the moderator on the site
Hi, I have an issue here. When I opened "Format Axis" and "Axis Options", there is no "Axis Type" choice here
This comment was minimized by the moderator on the site
Hi, Agassi, which Excel version you use?
This comment was minimized by the moderator on the site
Easy, useful, but i didn't know. Thanks a lot
This comment was minimized by the moderator on the site
But it doesnt show them in right relation to eachother. For example 2 hours and 6 hours are same in chart..
This comment was minimized by the moderator on the site
Hi Kiwi, maybe you can paint a chart to show me what you want the chart show.
There are no comments posted here yet
Load More
Please leave your comments in English
Posting as Guest
×
Rate this post:
0   Characters
Suggested Locations